Importance of data distribution in training machine learning models
November 13, 2015 Leave a comment
A fundamental task in many statistical analyses is to characterize the location and variability of a data set. A further characterization of the data includes data distribution, skewness and kurtosis.
What is Normal Distribution and why is it important in training our data models in Machine learning? The normal distributions are very important class of statistical distributions. All normal distributions are symmetric and have bell-shaped curves with a single peak (aka Gaussian Distribution). Creating a histogram on variable (variable values on Xaxis and its frequency on Yaxis) would get you a normal distribution.
When the distribution is normal then it obeys 68-95-99.7% rule. Which means
- 68% of data points/observations fall within +1*(Standard Deviation) to -1*(Standard Deviation) of mean
- 95% of data points/observations fall within +2*(Standard Deviation) to -2*(Standard Deviation) of mean
- 7% of data points/observations fall within +13*(Standard Deviation) to -3*(Standard Deviation) of mean

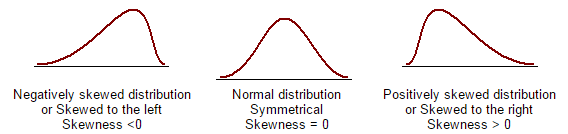
If the data distribution is not normal then it can be skewed to the left or right or completely random. Some of these cases are addressed through skewness and kurtosis.
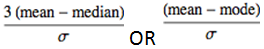
Skewness: The coefficient of Skewness is a measure for the degree of symmetry in the variable distribution. There are different formulae for calculating this skewness coefficient. Karl Pearson gave couple of formula
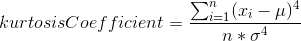
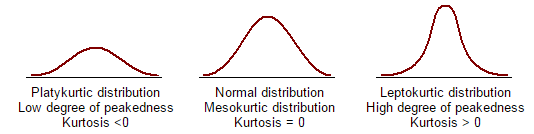
Kurtosis: Kurtosis is a measure of whether the data are peaked or flat relative to a normal distribution. That is, data sets with high kurtosis tend to have a distinct peak near the mean, decline rather rapidly, and have heavy tails. Data sets with low kurtosis tend to have a flat top near the mean.
Some basics to recollect to go through the distribution (mean, median and std dev)
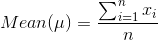
Mean: It is the sum of all observations divided by number of observations
Median: When all the observations are sorted in the ascending order, the median is exactly the middle value.
– Median is equal to 50th percentile.
– If the distribution of the data is Normal, then the median is equal to the arithmetic mean (which also equals Mode).
– The median is not sensitive to extreme values/outliers/noise, and therefore it may be a better measure of central tendency than the arithmetic mean.
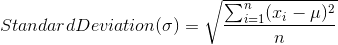
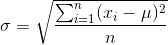
Standard Deviation: It gives the measure of the spread of the data. Average of squared differences from the mean is variance and square root of variance is std dev.
References
https://www.mathsisfun.com/data/standard-normal-distribution.html
http://www.itl.nist.gov/div898/handbook/eda/section3/eda35b.htm

Recent Comments